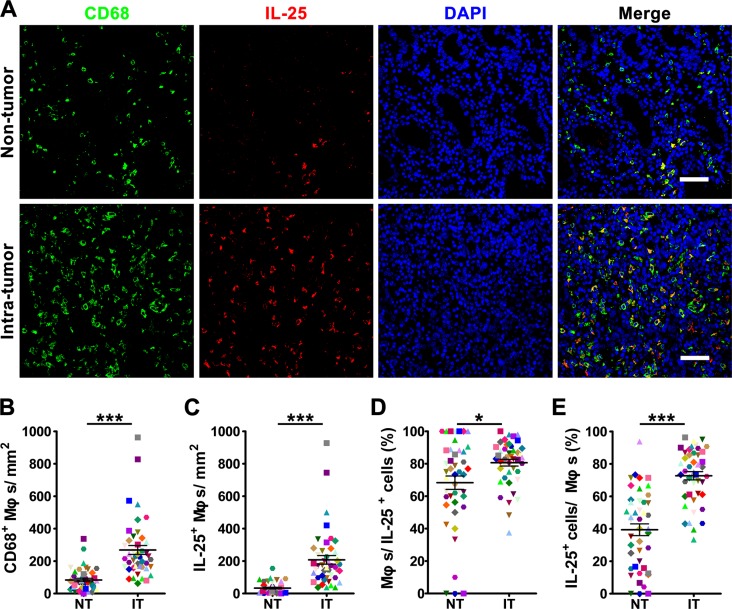
Figure 2. The majority of IL-25-expressing cells are produced in Mφs in human gastric cancer tissue.
(A) Double immunofluorescent staining shows the expression levels of IL-25 (red); Mφ marker CD68 (green) and co-localization of double-positive cells (yellow) in gastric cancer (GC) tissue. DAPI (blue) is used as a counterstain. Scale bar = 50 μm. (B-E) Comparisons between the densities of (B) CD68+ Mφs and (C) IL-25+ Mφs in non-tumoral (NT) and intra-tumoral (IT) regions of GC tissues; and the percentages of (D) IL-25+ cells and (E) CD68+ Mφs identified as double-positive (n = 44) compared to the total numbers of IL-25+ cells and CD68+ Mφs, respectively. Results are expressed as means ± SEM (bars); *p < 0.05; ***p < 0.001.

