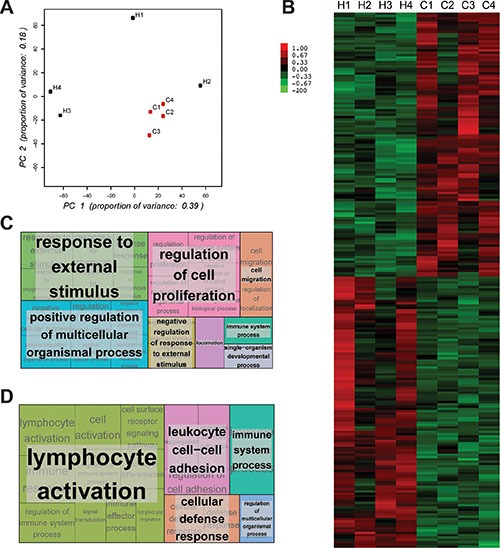
Figure 3. CD11b+ myelomonocytic cells from metastatic breast cancer patients and healthy donors show different expression profiles.

(A) PCA plot representing differential clustering of cancer patients (C1-4) and healthy donors (H1-4) based on mRNA expression profiles of CD11b+ cells. (B) Self-organizing heat-map of the top 100 genes with greatest variability across all samples, showing different expression profiles in CD11b+ cells from cancer patients compared to healthy donors. (C) Gene ontology analysis showing the most up-regulated biological processes comparing cancer patients and healthy donors. (D) Gene ontology analysis showing the most down-regulated biological processes comparing cancer patients and healthy donors.
