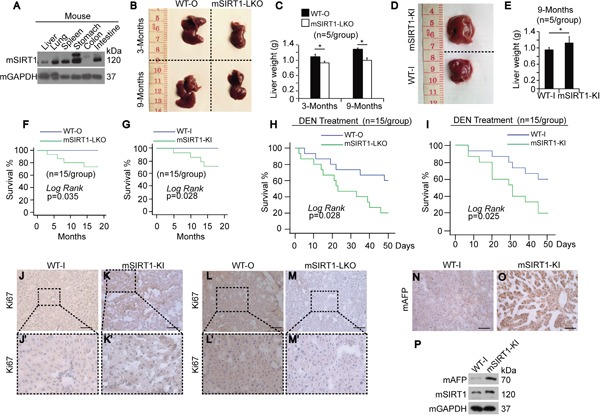
Figure 1. Phenotypes of mice with or without mSIRT1 knock-in or knock-out.

A. Western blots of mSIRT1 in different organs from mice as indicated. B. Livers of WT-O and mSIRT1-LKO at 3 or 9 months after birth. C. Weight of livers from WT-O and mSIRT1-LKO mice at 3 or 9 months after birth. n=5/group. D. Livers of WT-I and mSIRT1-KI mice at 9 months after birth. E. Weight of liver from WT-I and mSIRT1-KI mice at 9 months after birth. n=5/group. F-G. Survival curve of WT, mSIRT1-LKO, and mSIRT1-KI mice fed with routine diet over a period of 20 months. n=15/group. H-I. Survival curve of WT, mSIRT1-LKO, and mSIRT1-KI mice intraperitoneally injected with 50 mg/kg DEN. n=15/group. J-M. Representative images of IHC using anti-Ki67 antibodies in liver sections from WT, mSIRT1-KI, and mSIRT1-LKO mice. Boxes in panels j, k, l, and m are enlarged in panels j', k', l', and m', respectively. Scale bar, 500 μm. N-O. Representative images of IHC using anti-AFP antibodies in liver sections from WT-I and mSIRT1-KI mice. Scale bar, 500 μm. P. Western blots of mAFP in livers from WT-I and mSIRT1-KI mice.
