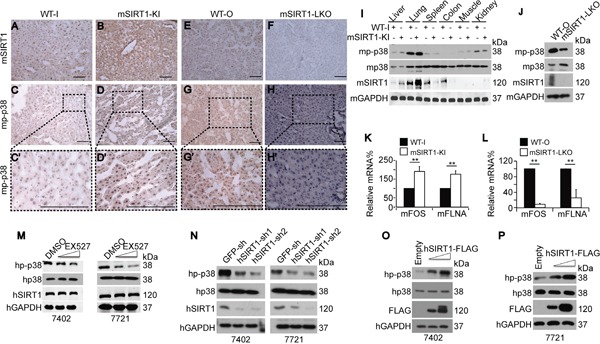
Figure 3. SIRT1 upregulated p-p38 in mouse livers and HCC cells.

A-H. Representative images of IHC staining with anti-SIRT1 and anti-p-p38 antibodies in the livers of WT, mSIRT1-KI, and mSIRT1-LKO mice. Boxes in panels C, D, G, and H are shown enlarged in panels C', D', G', and H', respectively. Scale bar, 500 μm. I. Western blots of mp-p38, mp38, and mSIRT1 in different organs in WT-I and mSIRT1-KI mice. J. Western blots of mp-p38, mp38, and mSIRT1 in the livers of WT-O and mSIRT1-LKO mice. K-L. mFOS and mFLNA mRNA levels in the livers of WT, mSIRT1-KI (K), and mSIRT1-LKO (L) mice, as measured by qPCR. M. Western blots of hp-p38, hp38, and hSIRT1 in Bel-7402 and SMMC-7721 cells treated with identical amounts of either DMSO or EX527 at final concentrations from 10 to 50 μM for 24 h before they were harvested for examination. N. Western blots of hp-p38, hp38, and hSIRT1 in Bel-7402 and SMMC-7721 cells infected with GFP-sh, hSIRT1-sh1, and hSIRT1-sh2, respectively. O-P. Western blots of hp-p38, hp38, and hSIRT1-FLAG (FLAG) in Bel-7402 (O) and SMMC-7721 (P) cells transfected with empty, or increasing concentrations of hSIRT1-FLAG-expressing, plasmids. The data are shown as mean±SD from three independent experiments (including WB). **, p<0.01 using the Student's t-test.
