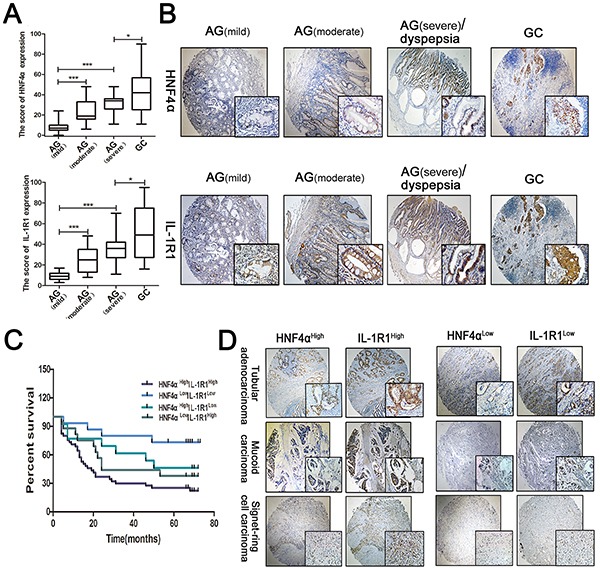
Figure 6. Expression of HNF4α and IL-1R1 in clinical gastric samples.

A. Box plots indicate the IHC score of HNF4α and IL-1R1 in different stages of gastritis and gastric cancer. The line in each box represents the median. *p<0.05, **p<0.01,***p<0.001 by Mann-Whitney U-test. B. IHC staining showed HNF4α and IL-1R1 were both up-regulated in the progression of gastric cancer. Representative images are shown here(magnification 40x, 400x). C. Kaplan-Meier survival curves for survival (months) of 90 gastric cancer patients stratified by HNF4α and IL-1R1 expression, including HNF4αHighIL-1R1High(n=45), HNF4αLowIL-1R1Low(n=15), HNF4αHighIL-1R1Low(n=13), and HNF4αLowIl-1R1High(n=17). The HNF4αHighIL-1R1High group had poorer outcomes than the HNF4αLowIL-1R1Low group (p=0.0011) D. Representative cases of different types of gastric cancer in HNF4αHighIL-1R1High group and HNF4αLowIL-1R1Low group. Magnification 40x, 400x.
