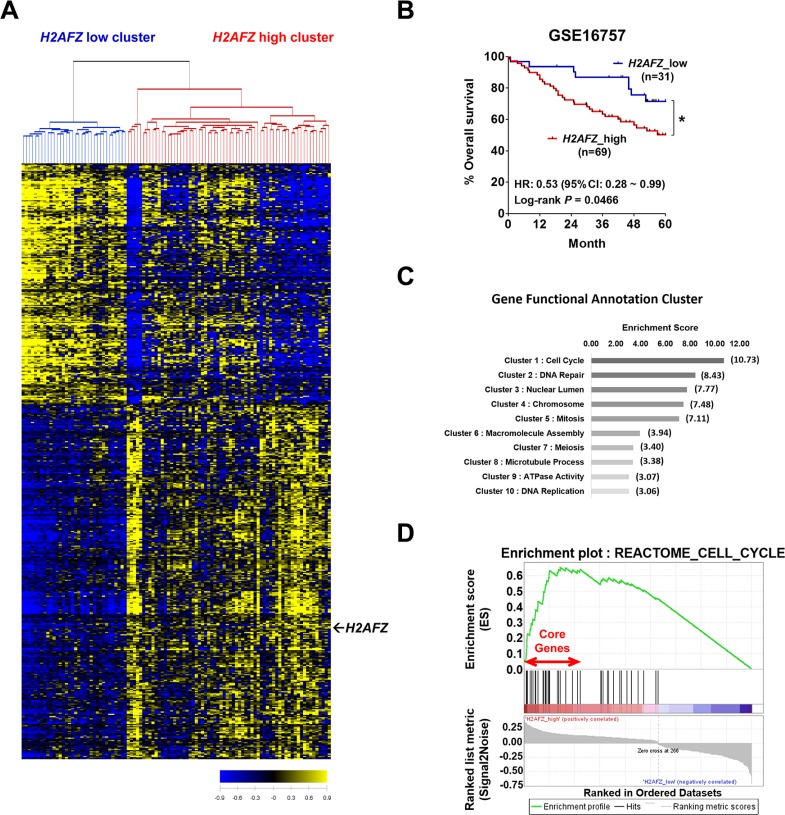
Figure 2. Clinical relevance of H2AFZ expression in HCC patients and cluster analysis of H2AFZ-associated genes.
(A) The microarray data were obtained from the GEO database (GSE16757). 524 genes were selected for cluster analysis (P < 0.01, r > 0.4 or r < −0.4). Patients were divided into H2AFZ low cluster and H2AFZ high cluster. (B) Kaplan-Meier survival curves for overall survival. P-values were obtained with the log-rank test. (C) Correlated genes with H2AFZ were subjected to DAVID, a molecular function mining tool. The bar graph shows a gene enrichment score of correlation gene annotation clusters with H2AFZ. (D) GSEA analysis of H2AFZ-specific molecular signature. A growth-related gene set (REACTOME_CELL_CYCLE) enriched to H2AFZ signatures is shown; the barcode indicates gene positions. The y-axis indicates the extent of enrichment.

