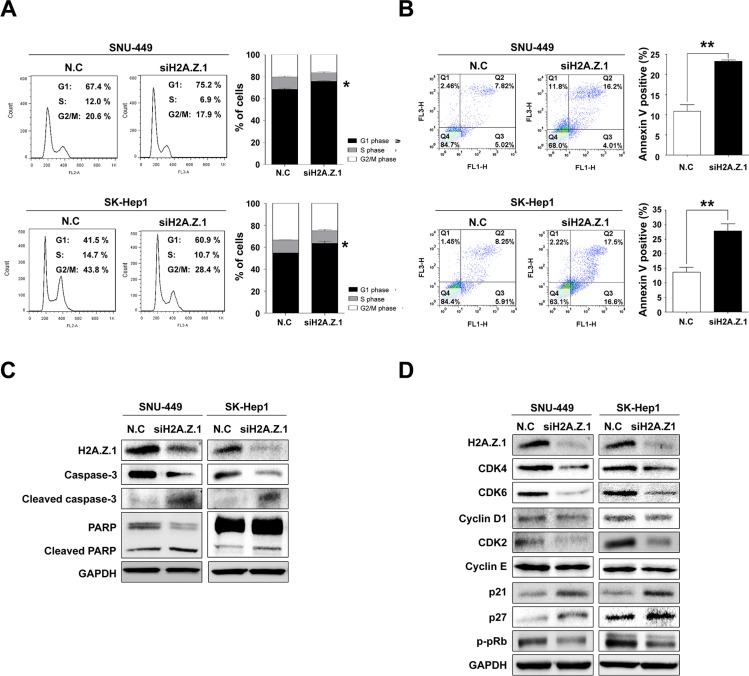
Figure 4. Targeted disruption of H2A.Z.1 caused cell death and cell cycle arrest in liver cancer cells.
(A) Cell cycle analysis. FACS analysis was conducted after negative control siRNA or H2A.Z.1 siRNA transfection. When H2A.Z.1 knockdown was induced, G1/S arrest occurred in SNU-449 and SK-Hep1 cell lines. The percentage indicates the distribution of the cells (mean ± S.D., n = 3, *P < 0.05). (B) Apoptosis analysis. Negative control siRNA (N.C) or H2A.Z.1 siRNA (siH2A.Z.1) were treated in SNU-449 and SK-Hep1 cell lines. After 72 hr, fluorescence-activated cell sorting analysis (FACS) was performed using PI (FL3-H) and annexin V (FL1-H) staining. The bar graphs indicated the percentage of annexin V positive cells (mean ± S.D., n = 3, **P < 0.001). (C) Western blot analysis of caspase-3, cleaved caspase-3, PARP, and cleaved PARP showed that H2A.Z.1 knockdown induced apoptosis in SNU-449 and SK-Hep1 cell lines. GAPDH was used as a loading control. (D) Western blot analysis. Negative control siRNA (N.C) or H2A.Z.1 siRNA (siH2A.Z.1) were treated in SNU-449 and SK-Hep1 cell lines. The protein levels of H2A.Z.1, CDK4, CDK6, Cyclin D1, Cyclin E, p21, p27, CDK2 and phosphorylated-pRb (p-pRb) were detected with their specific antibodies. GAPDH was used as the endogenous loading control.

