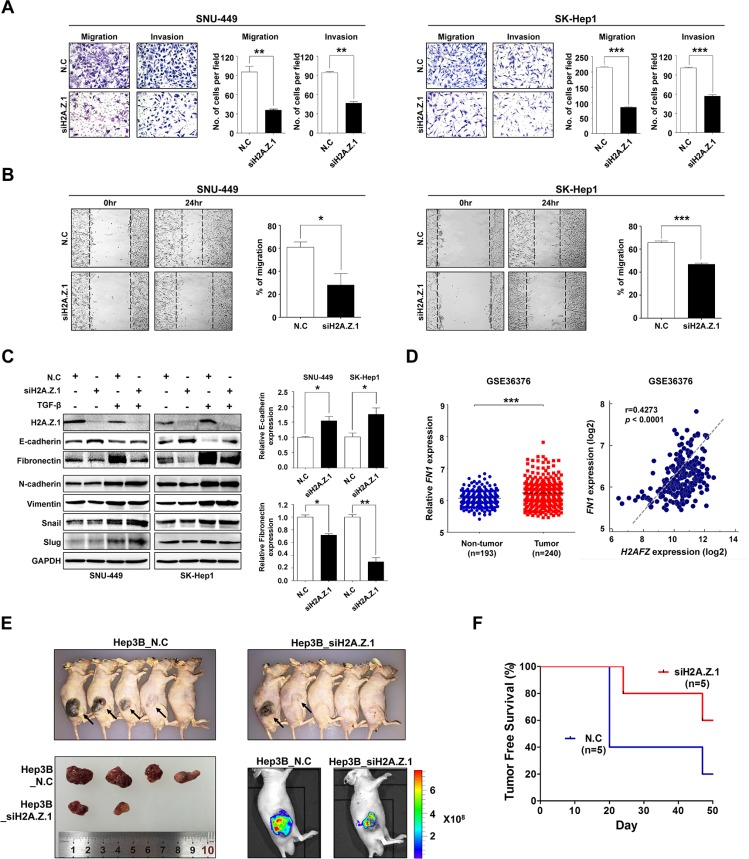
Figure 5. Repression of H2A.Z.1 expression inhibited the metastatic potential of liver cancer cells.
(A) The effect of H2A.Z.1 knockdown on in vitro cell migration and invasion. H2A.Z.1 knockdown inhibited migration and invasion of SNU-449 and SK-Hep1 cell lines. The cell number was determined by migrated and invaded cells. Three randomly selected fields were captured and presented by as a graph (mean ± S.D., n = 3, **P < 0.01, ***P < 0.001). The Figure images are representative images. (B) A scratch wound healing assay. A scratch in the plate on which the cell seeding was performed and incubated for 24 hrs. The bar graphs show the ratio of a recovered area (mean ± S.D., n = 3, ***P < 0.001, *P < 0.05). (C) A western blot analysis for EMT markers. The protein levels of H2A.Z.1, E-cadherin, fibronectin, N-cadherin, vimentin, snail and slug were detected with their specific antibodies. The GAPDH was made use for a loading control. Densitometry was used to quantify western blot data (mean ± S.D., n = 3, ***P < 0.001, *P < 0.05). (D) An analysis of microarray data from the Gene Expression Omnibus (GEO) database. A GEO data set of the accession numbers GSE36376 was used for expression analysis between H2AFZ and FN1. Left panel, FN1 mRNA expression in GSE36376. Right panel, positive correlation of H2AFZ and FN1 expression in GSE36376 (Pearson correlation coefficient r = 0.4273, ***P < 0.0001). (E) Tumor growth of animals injected with Hep3B transfected siH2A.Z.1 siRNA (Hep3B_siH2A.Z.1) or negative control siRNA (Hep3B_N.C). Images obtained at sacrifice after 50 days of mice (upper), tumor (lower left) and fluorescent image (lower right). (F) Kaplan-Meier tumor-free survival curves. The curve shows tumor-free survival of total 10 mice.

