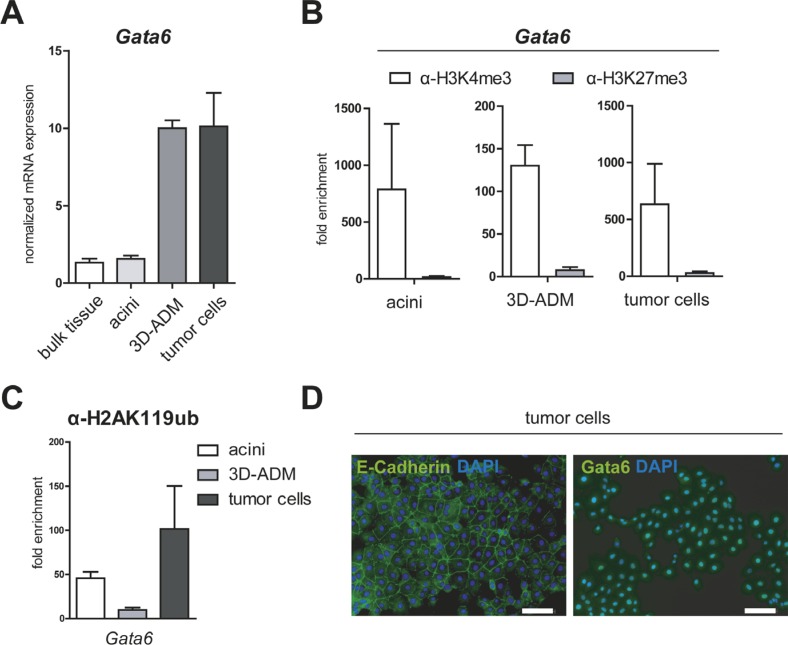
Figure 4. Gata6 is persistently activated in the in vitro sequence of pancreatic carcinogenesis.
(A) mRNA expression of Gata6 was analyzed in bulk pancreatic tissue, acini, 3D-ADM and tumor cells with RT-PCR. Data are normalized to bulk tissue and are represented as mean ± SEM (n = 3). (B, C) Epigenetic pattern of the Gata6 promoter was examined with ChIP-RT-PCR in acini, 3D-ADMs and tumor cells with antibodies against H3K4me3, H3K27me3 and (C) H2AK119ub. All ChIP-RT-PCR data are calculated as fold enrichment over IgG control and are represented as mean ± SEM (n = 3–5). (D) Representative pictures of E-Cadherin and Gata6 immunofluorescence staining of tumor cells. Nuclei are stained with DAPI. Bar, 100 μm.

