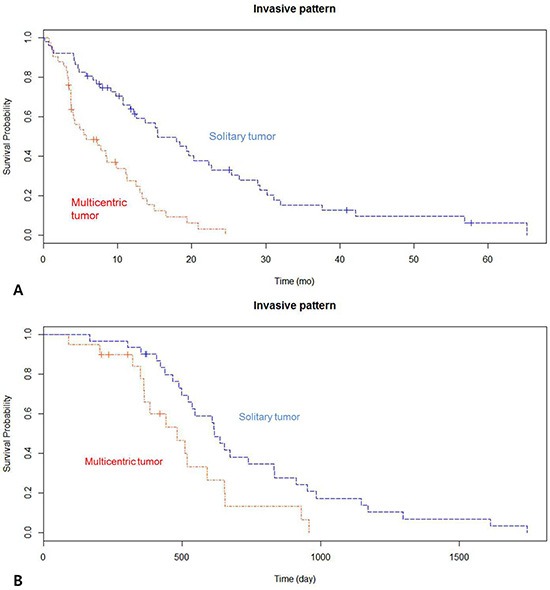
Figure 1.

(A) Kaplan-Meier survival curves showing overall survival between the two groups in the 51 patients with newly diagnosed glioblastoma (GBM). (B) Kaplan-Meier survival curve demonstrating overall survival between the two groups in the TCGA dataset with newly diagnosed GBM.
