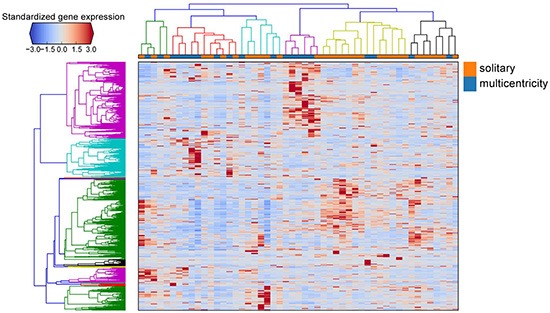
Figure 2. Hierarchical clustering of the gene expression matrix.

The standardized expression values of differentially expressed genes are shown in the heat map. Genes are clustered as the rows and patient samples are clustered as the column, with solitary and multicentricity tumor samples indicated by orange and blue, respectively.
