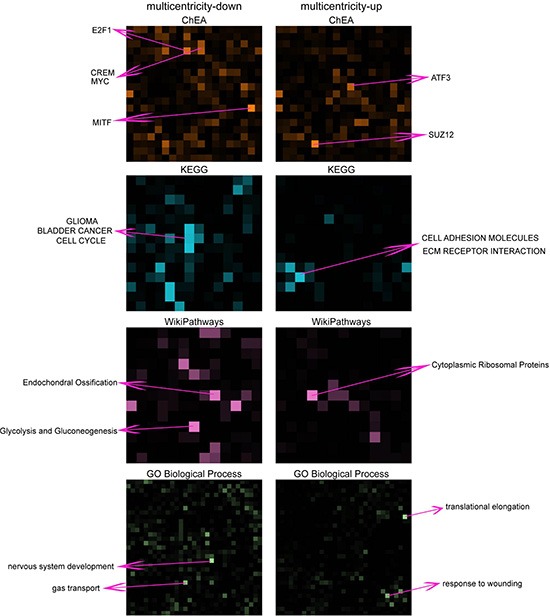
Figure 4. Visualization of enriched gene-sets in down- and up- regulated genes in multicentricity tumors over solitary tumors.

The enrichment of gene-sets for multicentricity and solitary tumors are shown in grids of different colors representing different gene-set libraries: ChEA, KEGG, WikiPathways and Gene Ontology Biological Process. Each square in the grid represents a gene-set and the brightness of the square positively correlate with the significance of the enrichment. Top enriched gene-sets are annotated.
