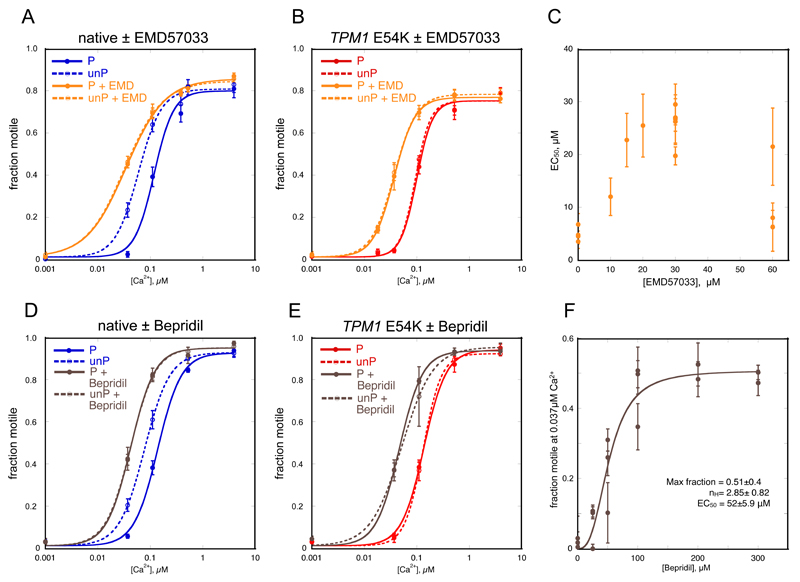
Figure 2. Effect of Ca2+-sensitisers on Ca2+ control of motility.
A, B, D, E. Fraction of filaments motile, measured by IVMA is plotted against [Ca2+] for representative experiments, details as for Figure 1.
A, D. Effect of Ca2+-sensitisers on Ca2+-regulation of native thin filaments. Blue, native thin filaments; orange, presence of 30 μM EMD57033; brown, presence of 100 μM Bepridil.
B, E. Effect of Ca2+-sensitisers on Ca2+-regulation of thin filaments containing the TPM1 E54K DCM-causing mutation. Red, E54K-containing thin filaments; orange, presence of 30 μM EMD57033; brown, presence of 100 μM Bepridil.
C. EMD57033 dose response curve: EC50 was determined at a range of EMD57033 concentrations. The change in EC50 (± SEM of 4 measurements of motility in the same motility chamber) is plotted for three separate experiments.
F. Bepridil dose response curve: motility was measured at a constant 0.037 μM Ca2+ with increasing concentrations of Bepridil. The increase in fraction of filaments motile (± SEM of 4 measurements of motility in the same motility chamber) is plotted for three separate experiments and the curve represents the fit of the pooled data to the Hill equation. Values of parameters obtained are shown.

