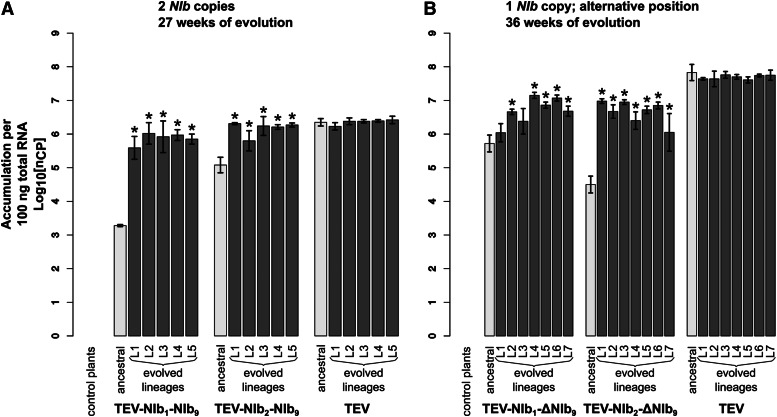
Figure 4.
Virus accumulation of the evolved and ancestral lineages. Virus accumulation, as measured by RT-qPCR, of the different viral genotypes with a duplication of NIb (A) and with NIb moved to an alternative position (B) with the wild-type TEV and healthy control plants. The ancestral lineages are indicated with light-gray bars and the evolved lineages with dark-gray bars. The viruses in A were evolved using five replicate lineages each (L1–L5) for a total of 27 weeks, and the viruses in B were evolved using seven replicate lineages each (L1–L7) for a total of 36 weeks. Evolved lineages that tested significantly different compared to their ancestral lineage are indicated with an asterisk (t-test with Holm-Bonferroni correction for multiple tests).

