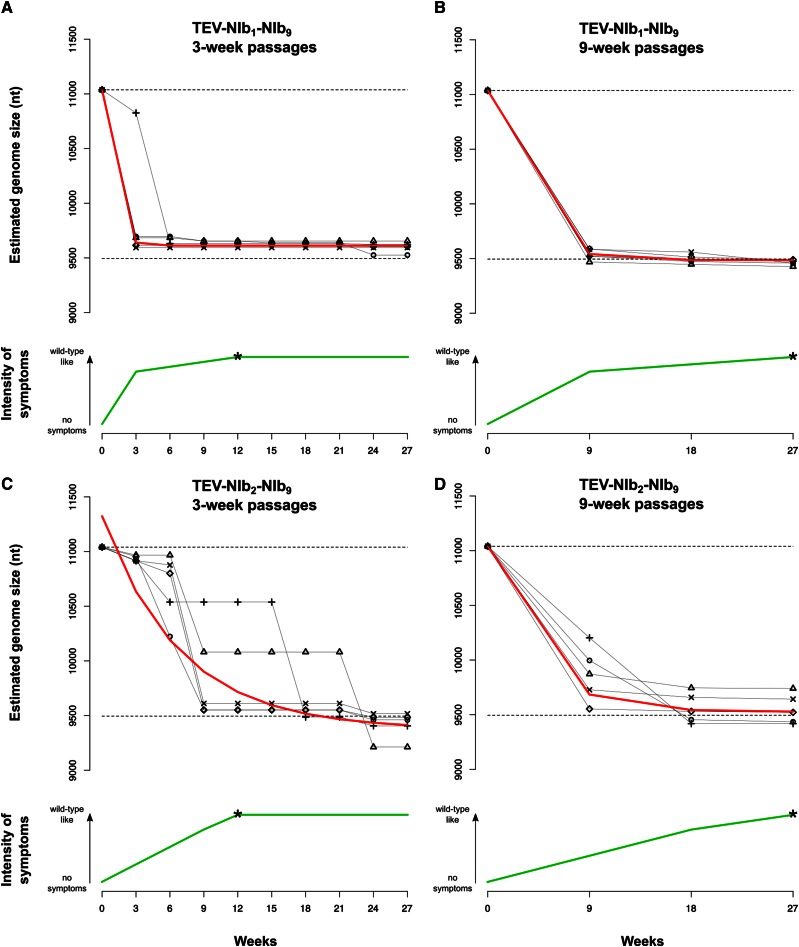
Figure 5.
Symptomatology and genome size over time of genotypes with a duplication of NIb. The different panels display how the genome size and symptomatology of the TEV-NIb1-NIb9 (A and B) and TEV-NIb2-NIb9 (C and D) genotypes change along the evolution experiments performing 3-week (A and C) and 9-week (C and D) serial passages. The green lines in each panel plot the observed severity of symptoms. The arrows on the left sides of the plots indicate the gradient from no symptoms to wild-type-like symptoms. The asterisk on each green line indicates the passage where we first observed wild-type-like symptoms (as described in the text). Note that for all genotypes we observed few or no symptoms at the beginning and wild-type-like symptoms at the end of the evolution experiment. The black symbols connected by continuous black lines represent the estimated genome size of the different viral lineages along the evolution experiment. The upper dashed lines represent the genome size of the ancestral viruses, and the lower dashed lines represent the genome size of the wild-type virus. The red line plots the median estimates of a nonlinear regression model. Note that the reduction in genome size appears to be negatively correlated with the severity of symptoms developed.

