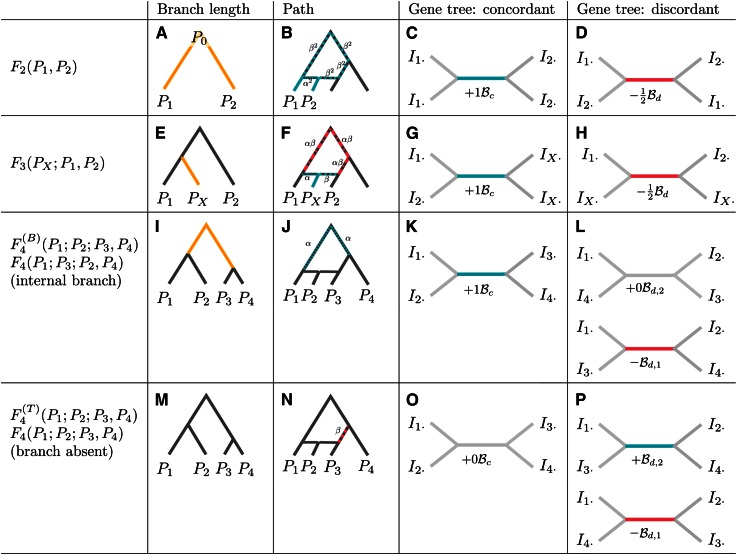
Figure 2.
Interpretation of F-statistics. F-statistics can be interpreted as branch lengths in a population phylogeny (A, E, I, and M), as the overlap of paths in an admixture graph (B, F, J, and N, see also Figure S1), and in terms of the internal branches of gene genealogies (see Figure 4, Figure S2, and Figure S3). For gene trees consistent with the population tree, the internal branch contributes positively (C, G, and K), and for discordant branches, internal branches contribute negatively (D and H) or zero (L). F4 has two possible interpretations; depending on how the arguments are permuted relative to the tree topology, it may reflect either the length of the internal branch [I–L, ] or a test statistic that is zero under a population phylogeny [M–P, ]. For the admixture test, the two possible gene trees contribute to the statistic with different sign, highlighting the similarity to the D-statistic (Green et al. 2010) and its expectation of zero in a symmetric model.

