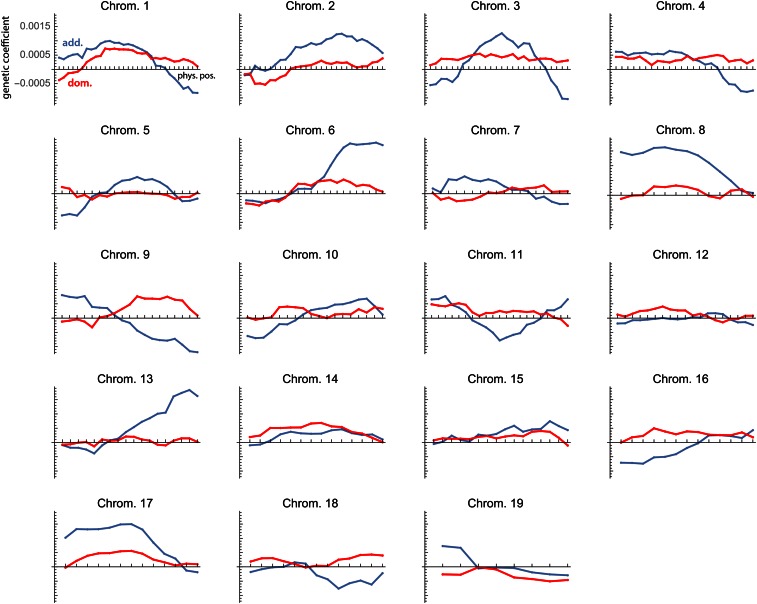
Figure 4.
Genetic coefficients for the first dimension of the analysis of all 19 chromosomes. They are the elements of the vector from approach ii and represent the partial additive and dominance effects (blue and red lines) of all 353 loci on the corresponding phenotypic latent variable (limb length; cf. Figure 3).

