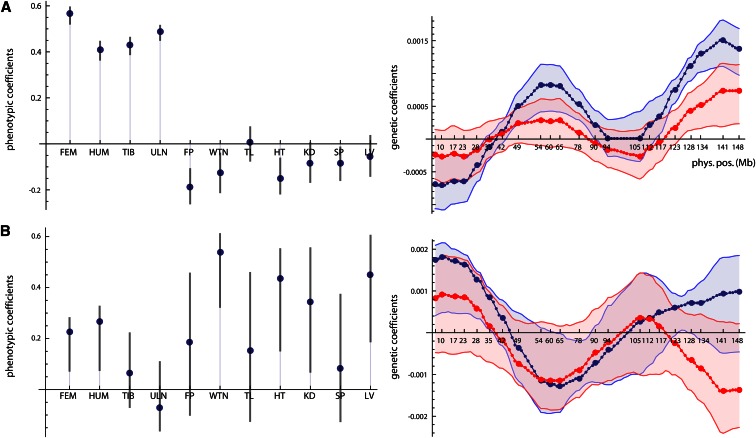
Figure 6.
(A and B) Phenotypic and genetic coefficients with 90% confidence intervals of the first (A) and the second (B) pair of latent variables for the separate analysis of chromosome 6. The first phenotypic latent variable reflected limb length and the second one body and organ weight. Additive and dominance effects are represented by blue and red lines, respectively. The 22 screened loci are represented by large symbols and the 89 imputed loci by small symbols.

