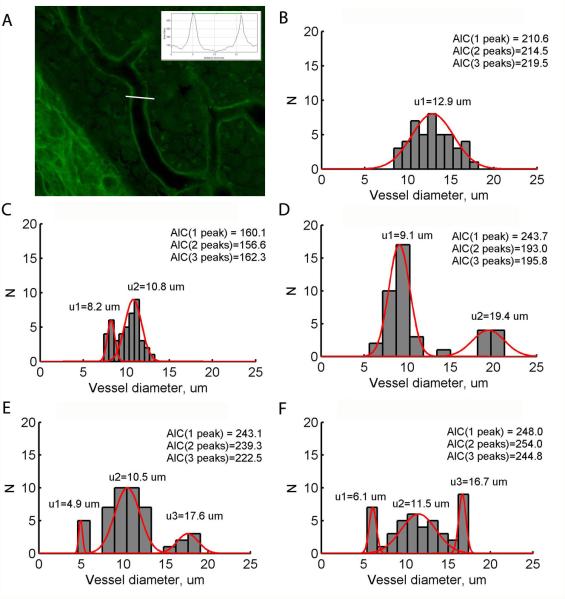
Figure 2.
Analysis of stria vascularis capillary diameters. A. Example image of stria vascularis labeled with fluorescein and lectin. The stria vascularis capillary widths were quantified by multiple samples of capillary diameters taken using ImageJ. White line illustrates example measurement of image intensity, and the intensity was plotted versus distance along this line (inset). The capillary width was calculated as the distance between two peak intensities in the intensity-distance plot (horizontal green line, inset). B-F. Example histograms of capillary size distributions in the stria vascularis of various animals. AIC calculations are shown for 1, 2, and 3 peaks in the distribution; the smallest AIC determines the number of peaks. Red curves show the best Gaussian fits to the determined number of peaks. Note the bimodal distribution of capillary widths for implanted animals in C-D and trimodal distributions in E-F.

