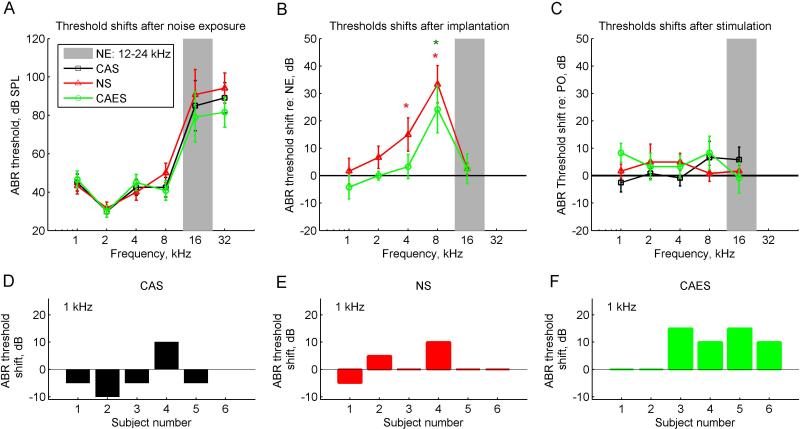
Figure 3.
Group-averaged ABR threshold changes due to noise exposure, implantation, and stimulation periods. Different symbols and colors represent the three subject groups; black squares represent the non-implanted CAS group, red triangles represent the implanted NS group, and green circles represent the implanted and stimulated CAES group. The gray bar indicates the frequency range of the noise exposure band (12-24 kHz). The vertical bars indicate standard deviations. A. ABR thresholds of the three groups after noise exposure. B. ABR threshold shifts of the implanted groups relative to the thresholds after noise exposure (NE) in A. Threshold shifts significantly greater than zero were seen for the NS group at 4 and 8 kHz, and for the CAES group at 8 kHz (asterisks; p=0.043, p=0.001, and p=0.045, respectively). C. ABR threshold shifts of the three groups at the conclusion of the study, i.e. after 9.5 weeks of electro-acoustic stimulation for the CAES group and the same time frame of acoustic-only and no stimulation for the CAS and NS groups, respectively. Threshold shifts are relative to post-operative (PO) thresholds. D-F. Distributions of threshold shifts at 1 kHz for the CAS, NS, and CAES groups, respectively.

