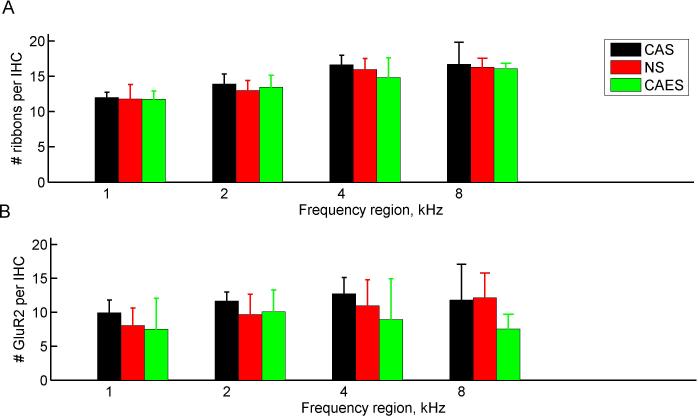
Figure 5.
Group-averaged presynaptic ribbon and post-synaptic receptor counts by frequency. Different colors represent the three groups as in Fig. 3. A. Presynaptic ribbon counts. Significant effects of group, but not frequency were observed (p < < 10−10, between/within subjects ANOVA). Post-hoc analyses revealed significant frequency differences for all groups between all frequency pairs except 4 and 8 kHz (p < 0.05, two-tailed t-test). B. Postsynaptic receptor counts. A significant effect of group, but not frequency, was observed (p = 0.02, between/within ANOVA). Vertical bars indicate standard deviations. (For interpretation of the references to color in this figure legend, the reader is referred to the web version of this article.)

