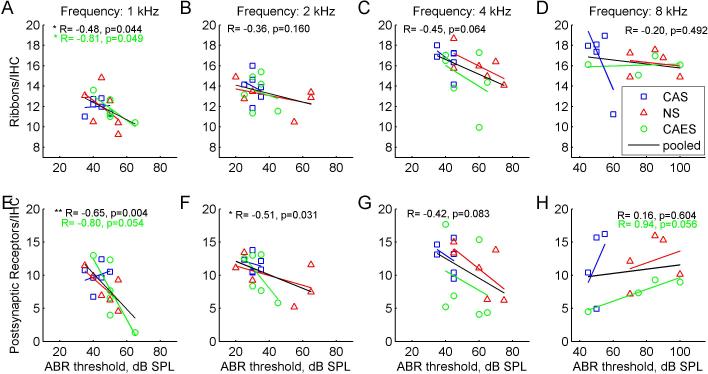
Figure 6.
Correlations of pre-synaptic ribbon and post-synaptic receptor counts with ABR thresholds by frequency. Different symbols and colors represent the three groups; blue squares represent the non-implanted CAS group, red triangles represent the implanted NS group, and green circles represent the implanted and stimulated CAES group. The corresponding colored lines represent linear fits to each group, and the black line represents the fit to the data pooled from all groups. Numbers at top of each figure indicate pooled correlation coefficients, and any individual group correlation coefficients with p-values <0.1. Note the shifted x-axis range for the 8 kHz correlations in D and H. Top row or A-D: ABR threshold-ribbon correlations for 1, 2, 4, and 8 kHz. Significant correlations were observed for the CAES group and for the pooled data at 1 kHz only (p<0.05, Pearson two-tailed correlation test). Bottom row or E-H: ABR threshold-post-synaptic receptor correlations for 1, 2, 4, and 8 kHz. Significant correlations were observed for the pooled data at 1 and 2 kHz (p<0.05, Pearson two-tailed correlation test). Note the larger y-axis range for the receptors compared to the ribbons in A-D.

