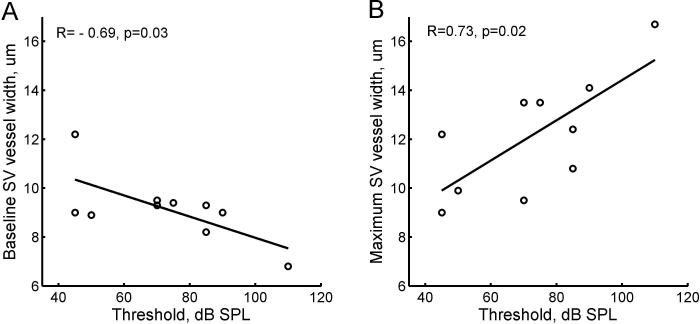
Figure 8.
Stria vascularis capillary widths at 6 kHz plotted versus acoustic thresholds at 8 kHz for individual animals in all groups. A. The minimum peak in the distributions of capillary widths, i.e. the first peak in Fig. 2B, versus threshold. A significant negative correlation (R=−0.69, p=0.03) was seen with threshold. B. The maximum peak in the distributions of capillary widths, i.e. the second peak in Fig. 2B when two peaks were present or the main peak when only one peak was present, versus threshold. A significant positive correlation (R=0.73, p=0.02) was seen with threshold.

