FIGURE 10.
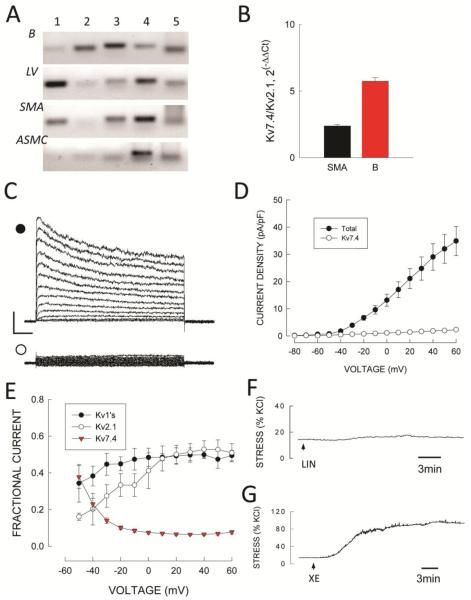
Kv7 channel expression in SMA. A: cPCR analysis of Kv7.1-7.5 subunit expression in RNA from brain (B), left ventricle (LV), intact arteries (SMA) and isolated SMA myocytes (ASMC). B: qPCR expression of Kv7.4 and Kv2.1 in SMA myocytes and brain and represented as 2−ΔCCt directly compared in the same samples. C: Total Kv (•) and Kv7.4 (○) currents in a SMA myocytes. Horizontal and vertical calibration bars represent 200 pA and 100 msec, respectively. D: Average values of peak Kv and Kv7.4 current density versus voltage. Symbols are mean values and vertical bars are ± 1 SEM (n=11). E: Relative amount of total Kv current of each component derived from experimental current data. Symbols are mean values and vertical bars are ±1 SEM. F/G. Effects of 10 μmol/L linopiridine (F, LIN) and 10 μmol/L XE-991 (G, XE) on wall stress (% KCl response) in SMA segments treated with 100 nmol/L phenylephrine plus 100 nmol/L iberiotoxin and 1μmol/L nifedipine. Horizontal bars represent 3 min.

