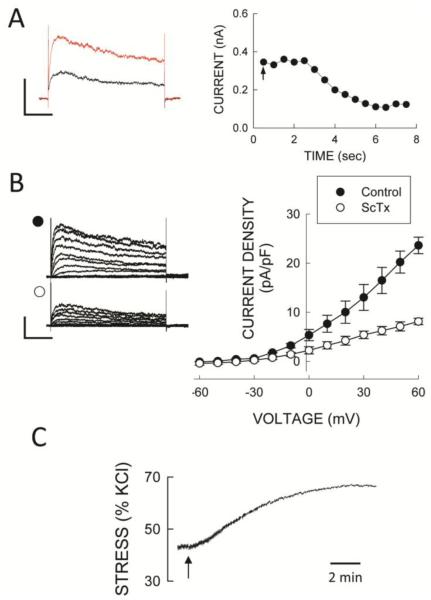
FIGURE 6.
Kv2.1 channels are functional in SMA. A: Time course of 100 nmol/L stromatoxin (added at the arrow) inhibition of whole cell Kv current in an SMA cell. B: Whole cell current-voltage relations before and after ScTx in the presence of 100 nmol/L IbTx and 1μmol/L nifedipine in SMA myocytes. Symbols are mean values and vertical bars are ± 1 SEM (n=8). Voltage clamp protocols are as described in Figure 2. Horizontal and vertical calibration bars represent 100 pA in A and 200 pA in B, and 200 msec, respectively. C: Effect of ScTx (arrow) on wall stress (% of KCl) in SMA segment precontracted with 100 nmol/L PE. Horizontal bar is 2 min.

