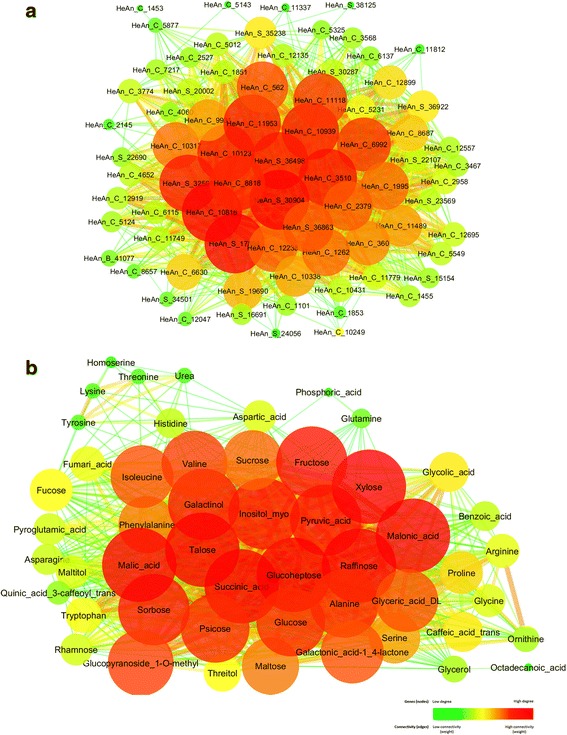
Fig. 1.

Networks exported from WGCNA visualized in Cytoscape. Network were constructed using 75 transcription factors (a) and 51 metabolites (b) and were visualized in Cytoscape [46] with an edge weight higher than 0.3. The nodes represent genes and metabolites and the edges represent connections between them. The node size and color is related to the number of connections, large red nodes represent highly connected hub genes and metabolites, small green nodes represent gene with few connections. Strong connections are visualized as wider lines
