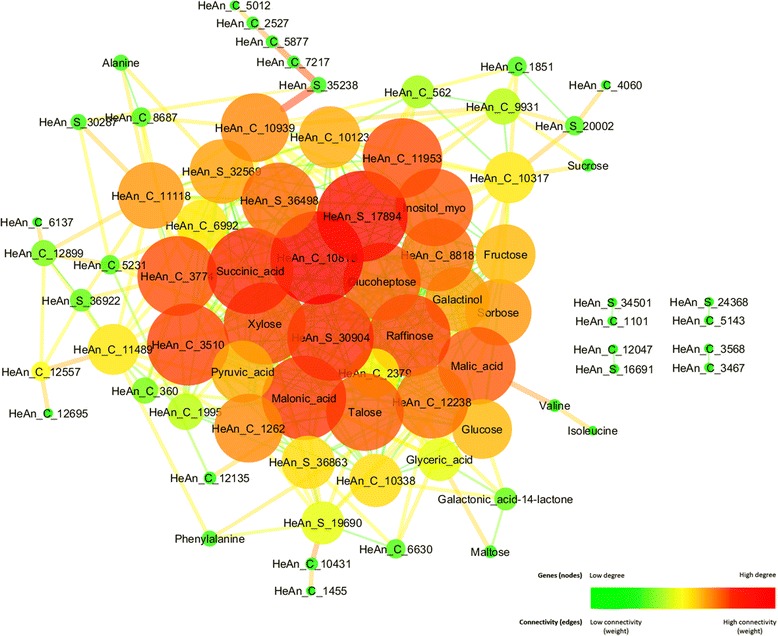
Fig. 2.

Integrated network of hubs metabolites and transcription factors. Pearson correlation analysis of 24 selected hubs metabolites and the list of 82 TFs statistically significant during senescence. Correlations with p-value < 0.0001 were selected and visualized in Cytoscape [46] by degree (node size and color) and edge weight (edge size and color)
