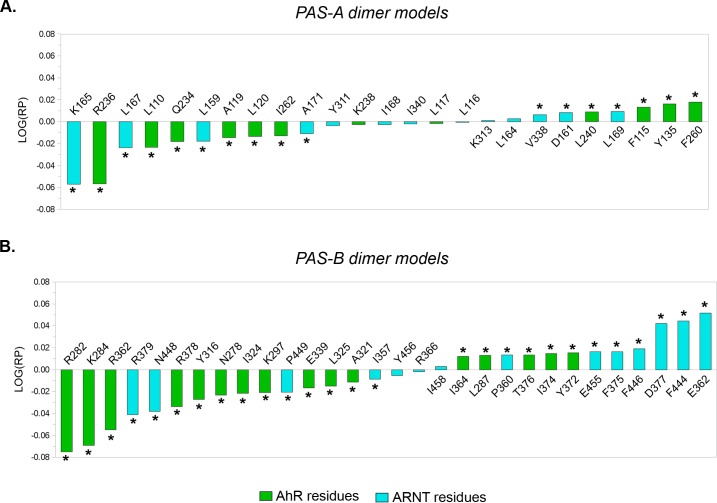
Fig 3. Rank Products profiles from the comparison of the PAS-A and PAS-B dimer models.
Asterisks denotes residues with a significant LOG(RP) value (e-value ≤ 0.05 after 10,000 random permutations). (A) Residues with a negative LOG(RP) value define the PASA.4F3L ∆G signature; residues with a positive LOG(RP) value define the PASA.4M4X ∆G signature. (B) Residues with a negative LOG(RP) value define the PASB.4F3L ∆G signature; residues with a positive LOG(RP) value define the PASB.3F1P ∆G signature.

