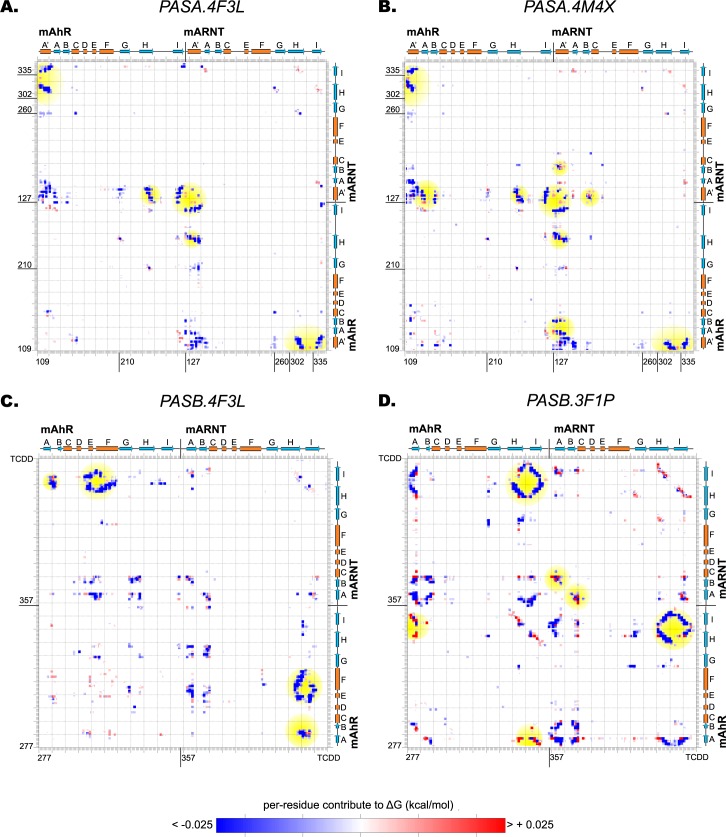
Fig 4. Interaction energy matrices of the PAS-A and PAS-B dimer models.
The blue and the red spots identify the energy couplings that define stabilizing or destabilizing contributions, respectively, accounting for the overall ΔGbinding of the complex. The spots discussed in the text are shaded in yellow. (A) PASA.4F3L dimer model. (B) PASA.4M4X dimer model. (C) PASB.4F3L dimer model. (D) PASB.3F1P dimer model.

