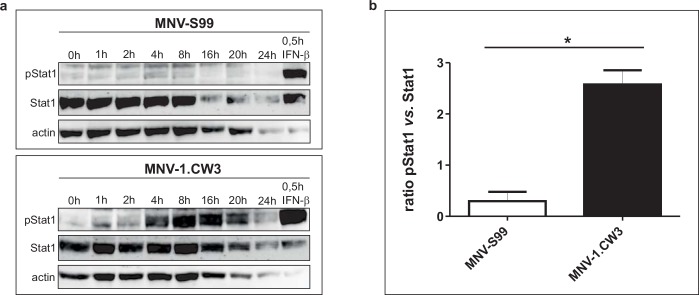
Fig 4. Stat1 activation is strongly decreased by MNV-S99 infection.
(a) RAW264.7 cells were infected either with MNV-S99 or MNV-1.CW3 strains using a MOI of 1 TCID50/cell for indicated time points. Cells were lysed with RIPA buffer, phosphorylation of Stat1 was analyzed by western blot analysis. As positive control for Stat1 phosphorylation, RAW264.7 cells were treated with 100 U/ml IFN-β for 30 minutes. (b) RAW264.7 cells were infected with MNV-S99 or MNV-1.CW3 using a MOI of 0.1 TCID50/cell for 16 h. Activation of Stat1 was measured by cell based ELISA assay. Activation was measured by the ratio of phosphorylated vs. non-phosphorylated Stat1. Data points were calculated as fold change of Stat1 activation after 16 hpi relative to mock infected cells. Four independent experiments were performed in duplicate. Statistically significant difference (p ≤ 0.05) was determined by Mann-Whitney-Test and is denoted by the asterisk.

