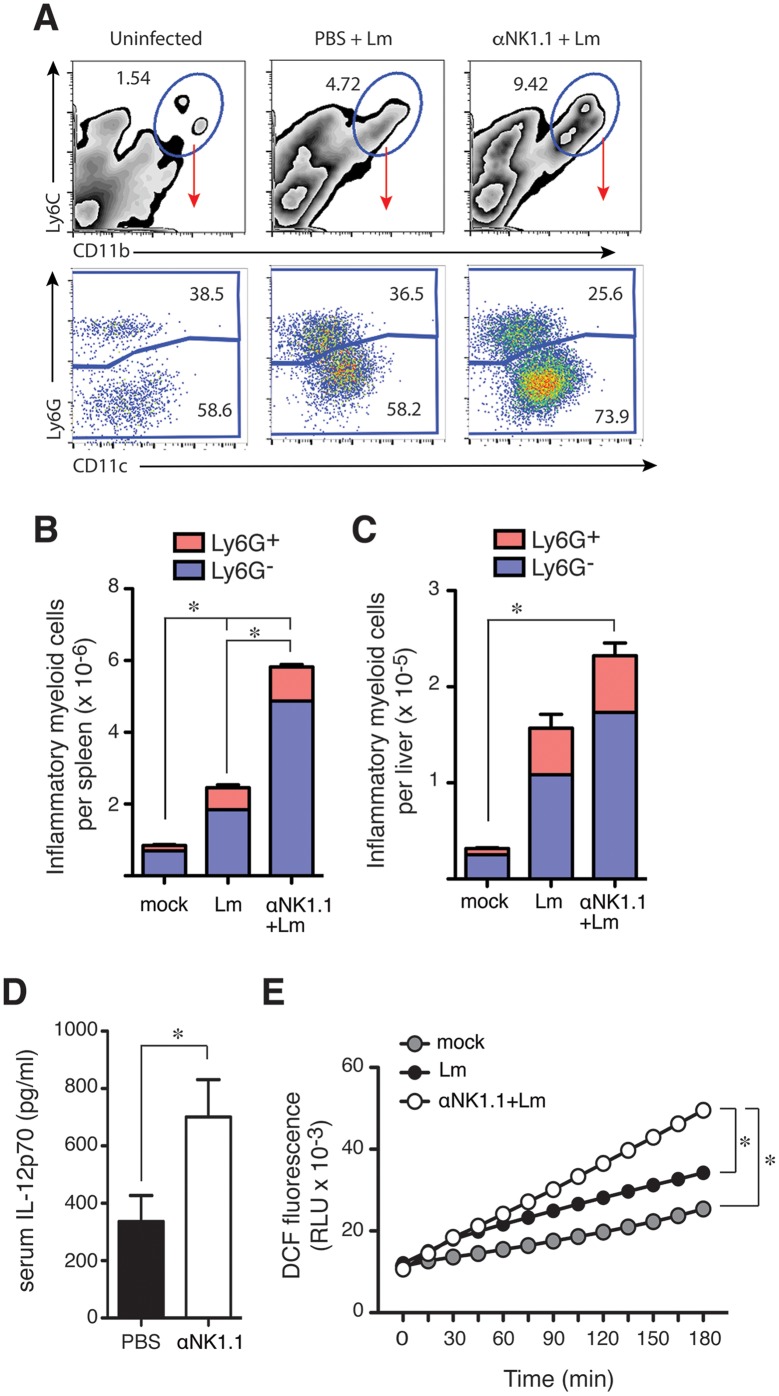
Fig 5. NK cells suppress innate responses and their production of IL-10 increases susceptibility to Lm.
(A) Splenocytes were harvested from uninfected or 72 hpi B6 mice and evaluated for the indicated myeloid cell markers. Top row depicts total live-gated population bottom row depicts the indicated gated population. Data are from individual mice and representative of more than n = 20 mice from over 5 experiments. (B) Splenocytes were harvested and analyzed as above. Shown are the mean ± SEM number of each indicated cell population per spleen as calculated from data gated as in (A). Data are from one of more than 5 experiments and represent n = 5 individual mice per group. (C) Leukocytes were isolated from livers of the indicated mice and analyzed as above. Shown are the mean ± SEM number of each indicated cell population per liver for one of 3 experiments and represent n = 5 individual mice per group. (D) Serum IL-12p70 for control IgG2a and αNK1.1-treated mice at 96 hpi. Shown are mean ± SEM from four pooled experiments representing n = 12–16 mice/group. (E) DCF fluorescence was measured at the indicated times after plating of labeled splenocytes harvested from uninfected (mock) or Lm-infected control IgG2a and αNK1.1 treated mice at 72 hpi. Shown are mean fluorescence values for triplicate wells from one of three experiments. *P<0.05 as measured by (B, C) ANOVA, (D) t-test, or (E) 2 way ANOVA.

