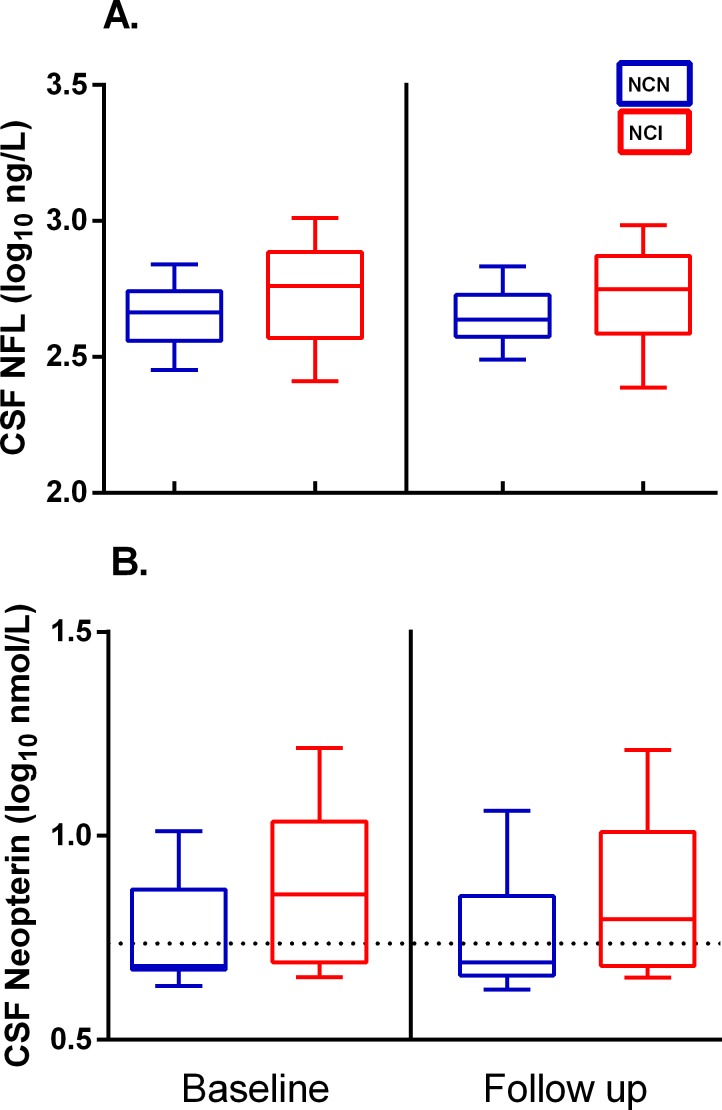
Fig 1. Overview of CSF biomarker distribution in the study groups.
Baseline and follow up distribution of CSF NFL (A.) and neopterin (B.) in neurocognitively normal (NCN) and neurocognitively impaired (NCI) subjects. Whiskers show 10-90th percentile. Values are log10 transformed for presentation. Dotted line represents upper normal reference for CSF neopterin (5.8 nmol/l).

