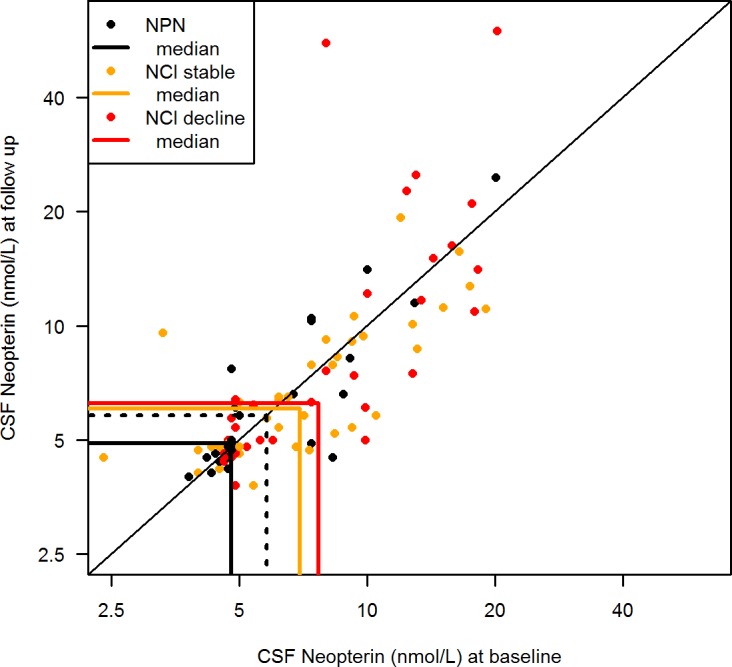
Fig 3. CSF neopterin in relation to neurocognitive status and longitudinal stability.

CSF neopterin at baseline (x-axis) and follow up (y-axis) in neurocognitively normal (NCN) and neurocognitively impaired (NCI) patients (stratified by stability of neurocognitive performance (NP) as NP-stable or NP-decline). Individuals are represented by circles and group medians by solid lines. Change in neopterin between visits is represented by the distance from the diagonal. Geometric mean CSF neopterin was significantly higher in neurocognitively impaired (NCI) patients than in neurocognitively normal (NCN) patients, as indicated by the distance between the medians (linear mixed effects model; p = 0.036). The upper normal reference for CSF neopterin is represented by the dotted line, and the proportion of patients with CSF neopterin above the upper normal reference was significantly higher in NCI patients (66%) than in NCN patients (43%) (Fishers exact test; p = 0.04). CSF neopterin was non-significantly higher in the NCI-decline group, compared to the NCI-stable group (linear mixed effects model; p = 0.1).
