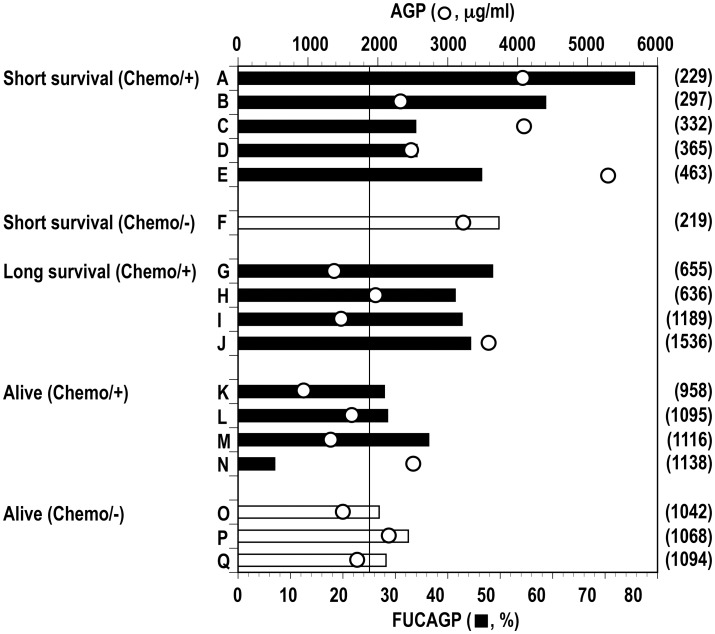
Fig 3. Levels of FUCAGP and AGP concentrations in serum samples from 12 cancer patients followed over long postsurgical periods.
Patients (A to Q) were classified according to their prognostic statuses. Refer to Table 1 for the details of prognostic status of each patient. Vertical bar indicates the cut-off level of FUCAGP set in this study. Closed and open bars indicate patients underwent chemotherapy and no chemotherapy treatment, respectively.

