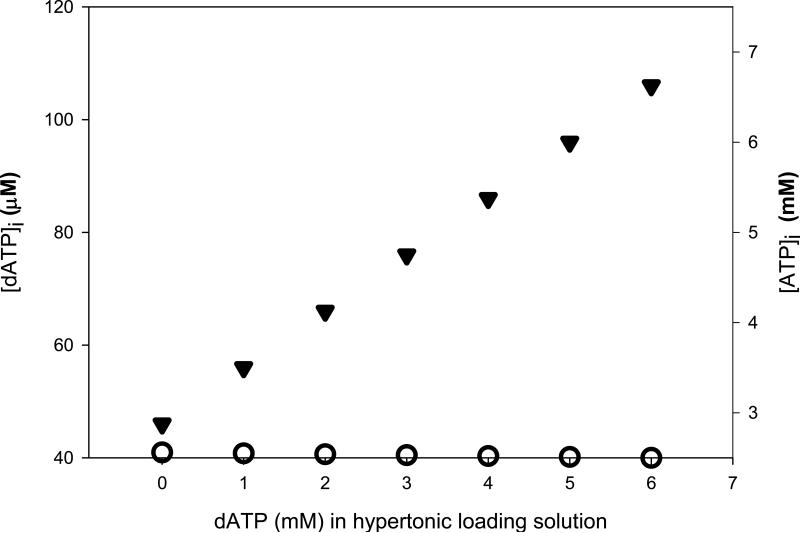
Fig. 3.
Final estimated intracellular concentrations of nucleotides following hypertonic loading. Hypertonic cell loading of 6 mM total NTP (6 mM ATP, 6 mM dATP, or a ratio of the two) at varying combinations resulted in indicated final estimated intracellular concentrations. Note differences in dATP (left, in μM) and ATP (right, in mM) y-axes. [dATP]i (solid triangles) was increased more than twofold over normal intracellular levels when 6 mM dATP was incorporated into the hypertonic loading media. Conversely, [ATP]i (open circles) increased by only ~2% when 6 mM ATP was loaded. Each y-axis represents a threefold increase over normal intracellular concentrations. Basal [dATP]i and [ATP]i are assumed to be 46 μM and 2.5 mM, respectively.

