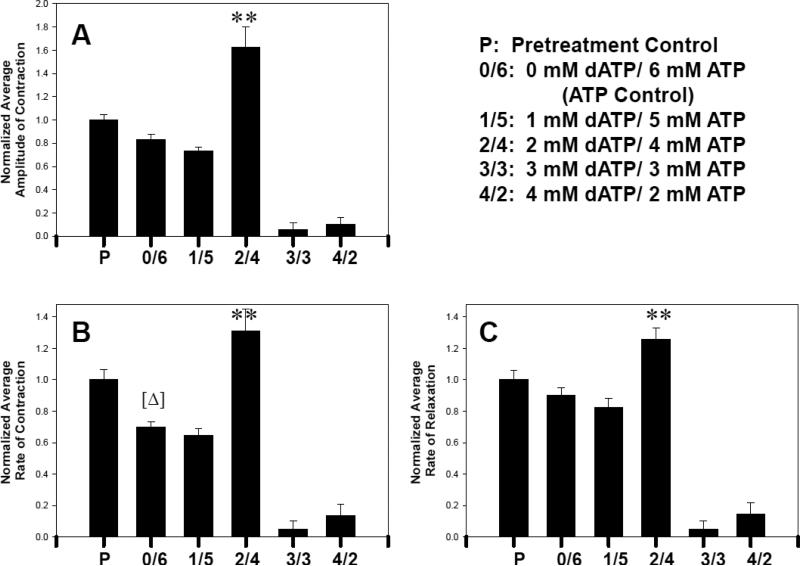
Fig. 5.
Contractile amplitude (A), rate of contraction (B) and rate of relaxation (C) obtained from chick cardiomyocytes in culture. Forty points were tracked per monolayer, as illustrated in Figure 3, and analyzed as described in Materials and Methods. Data from two monolayers for each nucleotide level of treatment were averaged and normalized to the average pre-treatment amplitude or rate of contraction. Error bars represent the SEM. ** Represents P≤0.01 where 2 mM dATP/4 mM ATP (2/4) is compared to 6 mM ATP control (0/6). In (A) and (C), ATP control (0/6) was not significantly different from pretreatment control (P), while in (B) ATP control (0/6) was significantly lower than P. [Δ] Represents P≤0.05 where ATP control was compared to P. Temperature was 25°C.

