Figure 1.
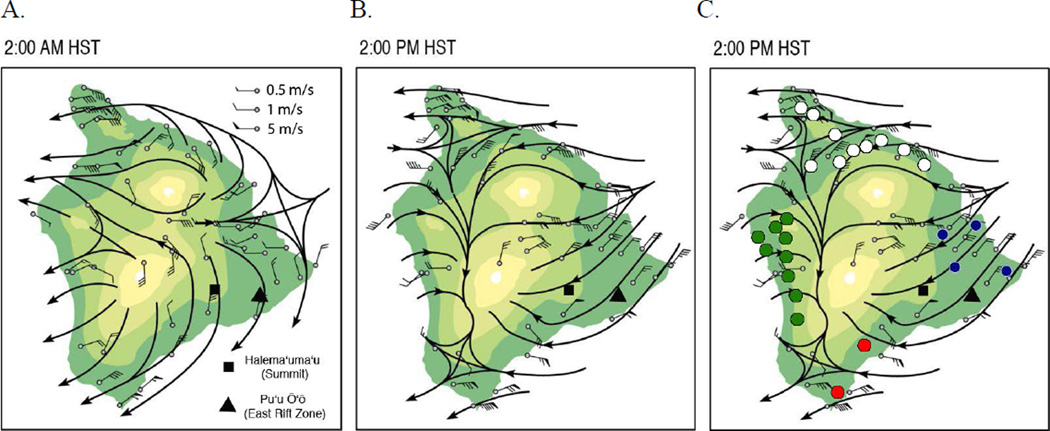
Halema’uma’u (Summit) and Pu’u ‘O’o (East Rift Zone) vents, tradewind pattern, July–August, 1990. Colors change with every 1000 m elevation.
A. Wind speed and direction during northeast winds, 2 a.m.
B. Wind speed and direction during northeast winds, 2 p.m.
C. Participating schools in vog exposure zones, 2002–2005: Low (white), Intermittent (blue), Frequent (red), Acid (green).

