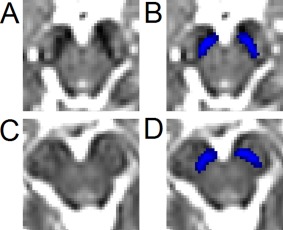
Figure 1.

Illustration of the inconsistency of SN hypointensity for two subjects with PD. Slices were placed four mm (two slices) below the red nucleus. The T2w hypointense SN for the first subject is shown in (A) with the NM SN (shown in blue) overlaid in (B). The T2w hypointense SN for the second subject is shown in (C) with the NM SN (shown in blue) overlaid in (D). Significant hypointensity is seen in (A) but is not present in the same region in (C). [Color figure can be viewed in the online issue, which is available at http://wileyonlinelibrary.com.]
