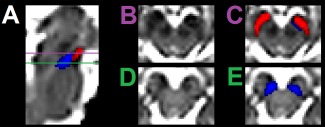
Figure 2.

Comparison of the spatial locations of the T2w SN volume (shown in red) and NM SN (shown in blue). A sagittal view of the brainstem from the b = 0 map is shown in (A). Axial views of the SN are shown in (B) and (D). The SN volumes overlaid on the axial images are shown in (C) and (E). [Color figure can be viewed in the online issue, which is available at http://wileyonlinelibrary.com.]
