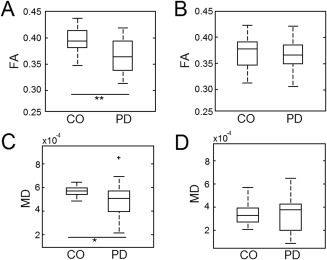
Figure 4.

Comparison of FA and MD in NM and T2w SN volumes. Box plots illustrating the mean FA for PD and CO groups in NM and T2w SN volumes are shown in (A) and (B), respectively. (C) and (D) display box plots illustrating the mean MD in NM and T2w SN volumes for PD and CO groups. In A and C, * and ** denote significance at the P = 0.05 and P = 0.001 levels, respectively.
