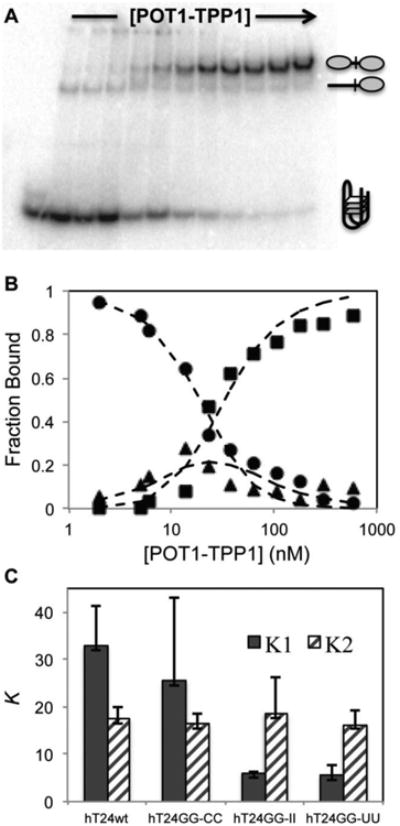
Figure 2.

The binding of POT1-TPP1 to adjacent sites on DNA substrates in NaCl containing buffer. (A) EMSAs were performed under equilibrium binding conditions to determine the effects of DNA secondary structure on initial and subsequent binding of POT1-TPP1 proteins. The gel shown here reveals the binding profile for POT1-TPP1 interactions with hT24wt DNA. (B) The bands in the EMSA were quantified by autoradiography and plotted. The fraction of total protein was plotted for zero (●), one (▲), or two (■POT1-TPP1 binding stoichiometry as a function of increasing protein concentration. Dashed lines are the least-square global fit to a sequential binding mechanism (Scheme 1) used to estimate the equilibrium dissociation constants K1 and K2. Three independent binding experiments were analyzed to calculate average values and standard deviations for each DNA substrate (Table 1). (C) Summary of the EMSA fitting data. The average K1 (filled columns) and K2 (hashed colums) values (in nM) and their standard deviations are shown for each DNA substrate.
