Figure 4.

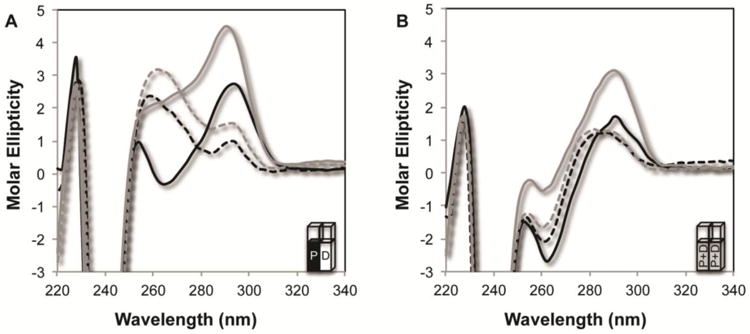
Combined CD spectra of free POT1-TPP1 with free DNA and POT1-TPP1-DNA complexes. (A) CD spectra obtained using a split cell containing POT1-TPP1 in one chamber and either hT24wt or hT24GG-II DNA in the second chamber. The combined spectra contain the CD signatures of both free protein and free DNA. Spectra were taken with 10 μM POT1-TPP1 in one chamber and the second chamber containing 2 μM of either hT24wt in 150 mM NaCl (solid black line), hT24wt in 150 mM KCl (solid grey line), hT24GG-II DNA in 150 mM NaCl (dashed black line), or hT24GG-II in 150 mM KCl (dashed grey line). (B) To measure the changes in CD spectra due to protein-DNA complex formation, solutions from the two chambers in the split cell were mixed together and incubated for 20 minutes before the CD spectra of the resulting DNA-protein complexes were measured. Sample labels are the same as in panel (A).
