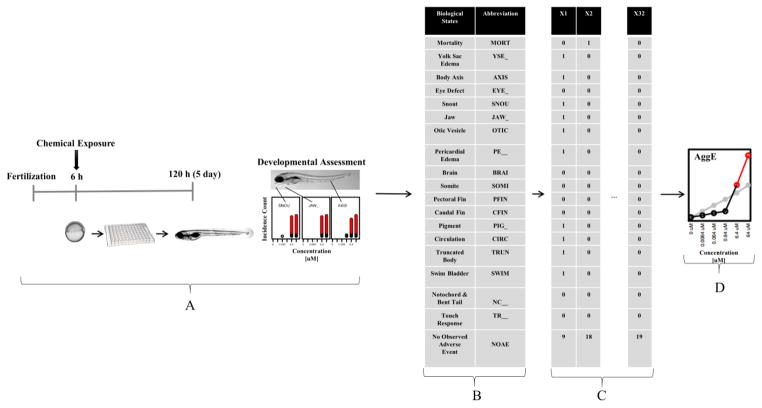
Figure 1.
Experimental Design and Data Structure. A) Chemical exposure started at 6hpf. At 120hpf, 18 distinct developmental assessments were measured. B) 19 biological states (developmental assessments plus NOAE) with their abbreviations. C) Data structure showing three example vectors from n=32 individual wells per concentration-by-chemical. X1 indicates many developmental problems observed; X2 shows mortality; X32 represents no phenotypic consequences recorded. D) Aggregate Entropy, in nats (natural unit of information) on the vertical axis by concentration on the horizontal axis. The black lines connect the concentration-wise AggE for this example chemical, turning red at the point-of-departure concentration, where the line crosses the grey significance threshold.

