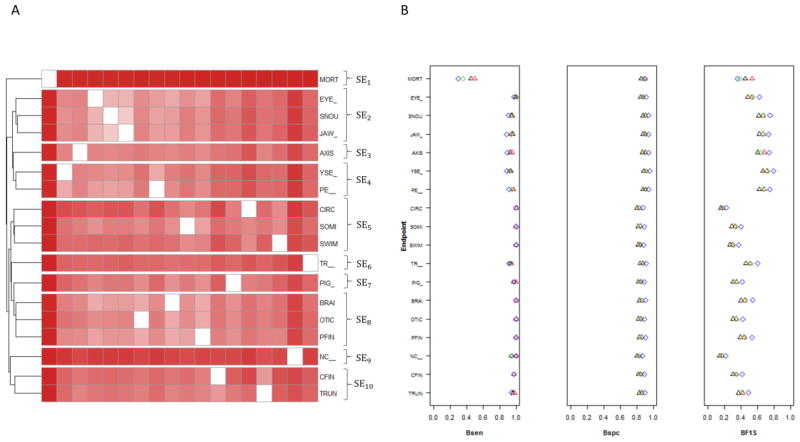
Figure 4.
A) Heatmap showing hierarchical clustering using normalized information distance with Ward linkage. SE: Super Endpoint. B) Comparison of the predictive power of chemicals that caused significant morphological effect by applying our method on single endpoint with mortality (black triangle); without mortality (green diamond) vs. super endpoint with mortality (red triangle); without mortality (blue diamond). Note that only the super endpoint (red triangle, blue diamond) will be visible for cases of perfect overlap with single endpoints. Bsen: Balanced Sensitivity; Bspc: Balanced Specificity; BF1S: Balanced F1 Score.

