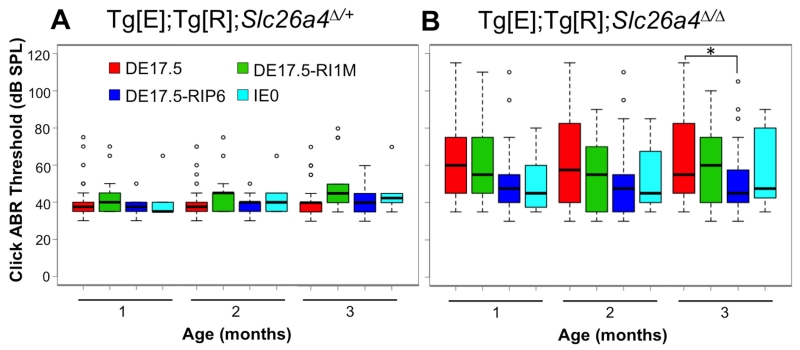
Figure 2.
Auditory Brainstem Response (ABR) Thresholds.
Box plots of click ABR thresholds measured at 1, 2 and 3 months of age are shown for the DE17.5, DE17.5-RI1M, DE17.5-RIP6 and IE0 groups of (A) Tg[E];Tg[R];Slc26a4Δ/+ ears (n = 30, 14, 14 and 6, respectively) and (B) Tg[E];Tg[R];Slc26a4Δ/Δ ears (n = 44, 30, 28 and 12, respectively). The box includes the median (heavy line) and represents the first and the third quartiles. The whiskers show the range of data points that are within ≤1.5 times the interquartile range from the box. Threshold values outside the range of whiskers are indicated by dots. *p < 0.05.

