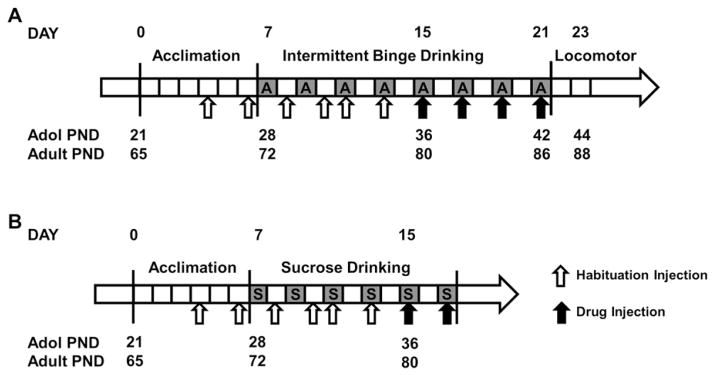
Fig. 1.
Timeline of adolescent and adult drinking. (A) Binge-like alcohol drinking. (B) Binge-like sucrose drinking. Each box represents one day. Top numbering describes the experimental day of each phase of the experiment, and bottom numbering describes the age of adolescent and adult mice in post-natal days (PND) at each time point during the experiment. Gray boxes marked “A” indicate alcohol drinking days and “S” indicate sucrose drinking days, respectively. Unfilled arrows indicate habituation vehicle injections, solid arrows indicate drinking sessions preceded by a drug injection.

