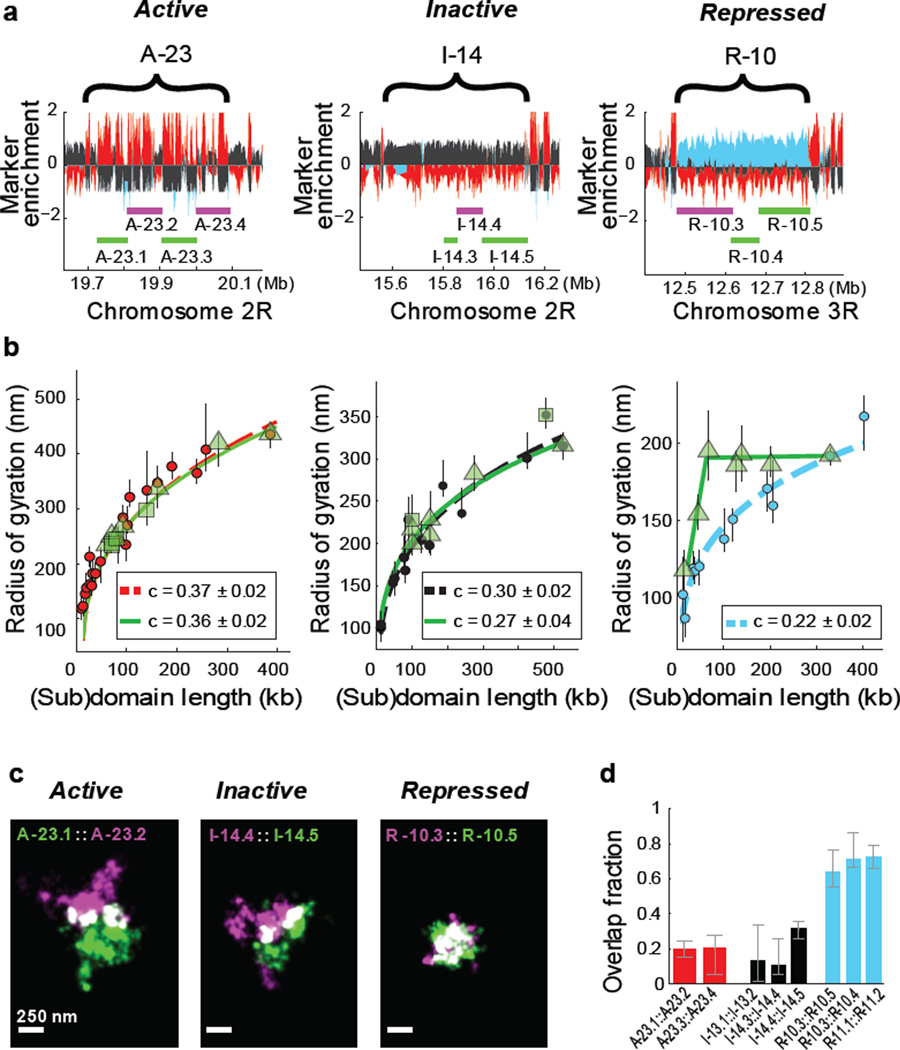
Figure 2. Different types of epigenetic domains exhibit distinct subdomain scaling and intermixing.
a, Marker enrichment profile of three genomic regions with the example epigenetic domains marked by brackets and imaged subdomains marked by green and magenta lines. b, Linear plot of the radius of gyration as a function of the subdomain length (green symbols), compared to those for the whole domain data (red, black or light blue circles), for active (left panel), inactive (middle panel) and repressed chromatin (right panel). Different green symbols (triangle and squares) represent subdomains of two different parent domains. Power-law fits of subdomains (green solid lines) and whole domains (red, black and light blue dashed lines) are shown with the scaling exponent c given in the legends. The green lines in the right panel are to guide the eye. c, Two-colour, 3D-STORM images of example pairs of subdomains within active (left), inactive (middle) and repressed (right) domains. Portions of the two subdomains that overlap in 3D are shown in white. The two subdomains are labelled with Alexa-647 and Alexa 750 tagged DNA probes, respectively. d, Quantification of overlap fraction between the subdomains for active (red), inactive (black), or repressed (light blue) chromatin (Supplementary Methods). Error bars represent 95% confidence intervals derived from resampling (n ≈ 50 cells).

