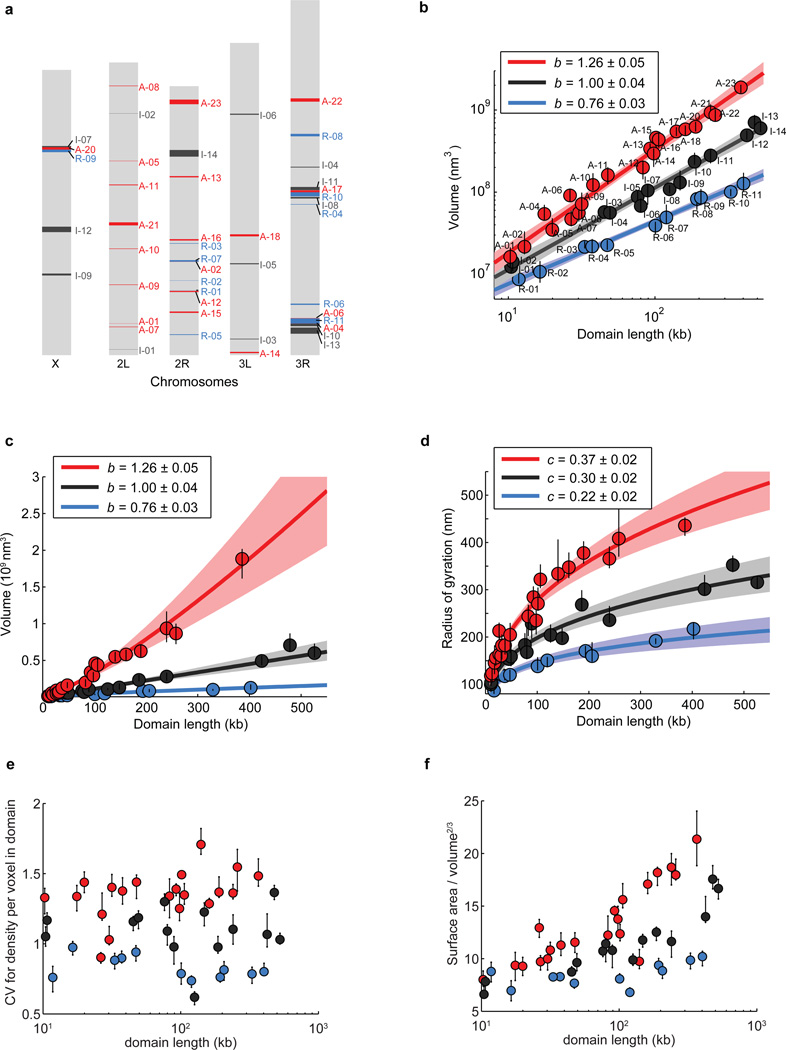
Extended Data Figure 3. Volume, radius of gyration and other shape characteristics for chromatin domains of various domain lengths in three different epigenetic states.
a, Scheme of Drosophila chromosomes (X, 2L, 2R, 3L, and 3R) with the position of the imaged epigenetic domains marked (Red: active domains A-01 to A-23; Black: inactive domains I-01 to I-14; Blue: repressed domains R-01 to R-11). b, Log-log plot of the median domain volume as a function of domain contour length reproduced from Fig. 1c but with the domain ID labelled. c, As in Fig. 1c but plotted on a linear-linear scale. d, Linear plot of the median radius of gyration as a function of domain contour length. e, Coefficient of variation (CV) in density per voxel for all domains as a function of domain length. CV in density is defined as the ratio of the standard deviation of density to the average density within the domain-occupied volume, which characterizes how uniformly the chromatin is distributed in space within these domains (Supplementary Methods). f, Ratio of surface area to volume2/3 for all domains as a function of domain length. This surface-to-volume parameter characterizes the complexity of the physical shapes taken by the domains in 3D (Supplementary Methods). Error bars represent 95% confidence intervals derived from resampling.

