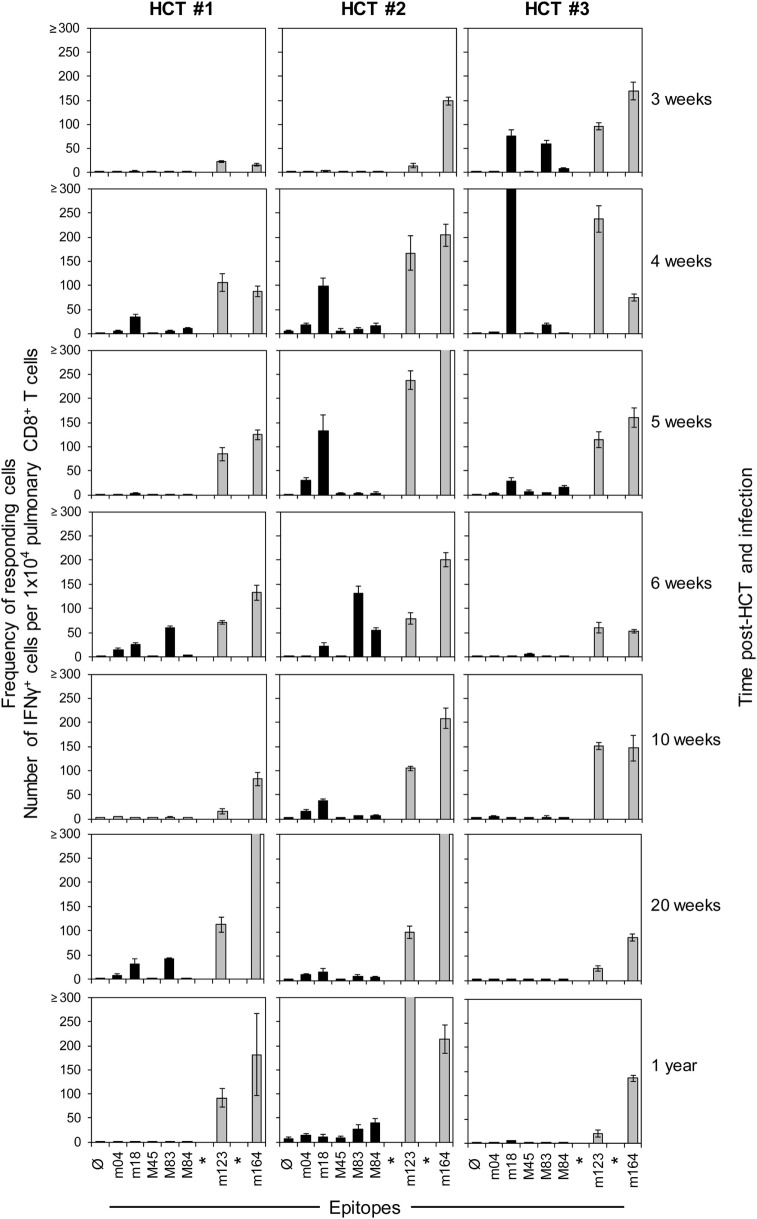
Figure 2.
High dynamics of epitope-recognition patterns after HCT. Corresponding to Figure 1, frequencies of immunomagnetically purified pulmonary CD8+ T cells responding in an ELISpot assay with IFN-γ secretion to stimulation with peptide-loaded stimulator cells were determined for a pool of at least four mice per indicated time. Bars represent the most probable numbers, and error bars indicate the 95% confidence intervals determined by linear regression analysis. Gray-shaded bars highlight responses to epitopes known to drive memory inflation (MI), namely m123/IE1 and m164. *Epitopes addressed later in this work but not yet known at the time when these HCTs were performed. Ø: no peptide added.

