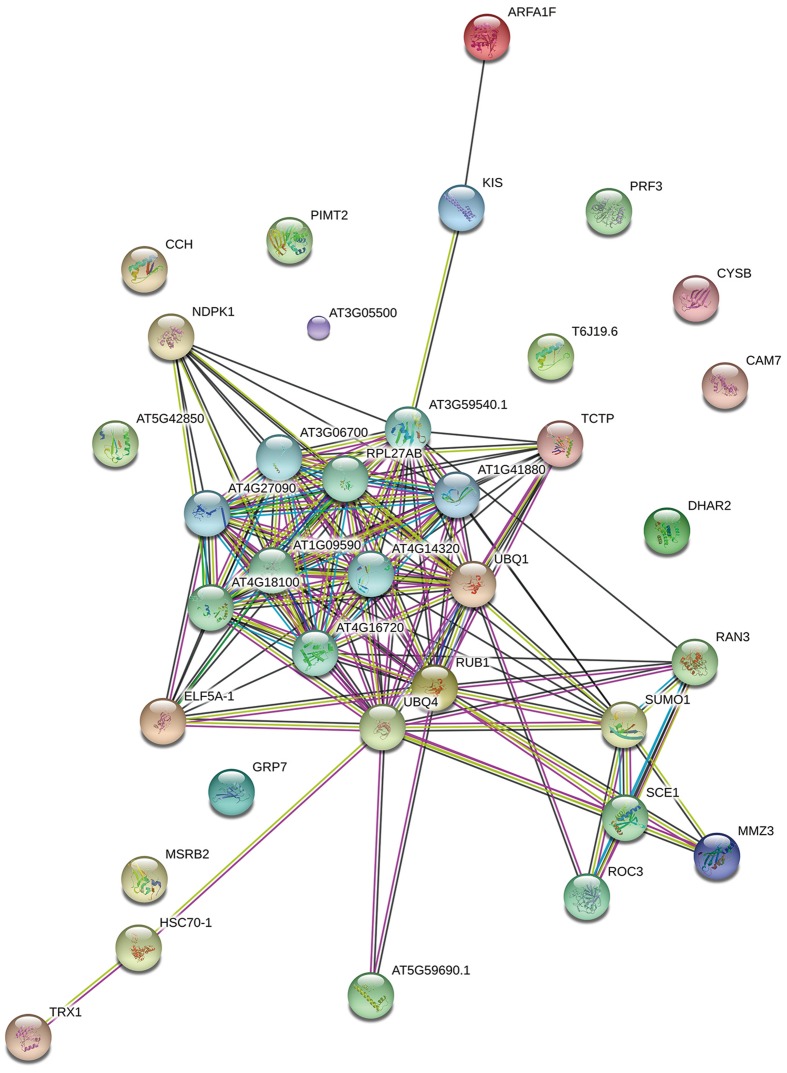
FIGURE 5.
Functional networks of the identified L. tulipifera floral nectar proteins. Different line colors represent the types of evidence used in predicting the associations: gene fusion (red), neighborhood (green), co-occurrence across genomes (blue), co-expression (black), experimental (purple), association in curated databases (light blue), text mining (yellow), homology (light purple).

